
Check Core Web Vitals Now if You Want to Rank on Page 1 of Google
In June 2021 Google will be rolling out the biggest change to its search ranking algorithm in recent years. It’s called Core Web Vitals and is part of the Page Experience metrics Google uses to track the user experience of your web pages.
It will have a large impact on the results on Google’s search engine results pages, so website owners should take notice and prepare. If your website offers its visitors a great experience already, then the introduction of Core Web Vitals will likely mean that your results in Google search rankings will improve. If not, then your rankings may drop.
This post gives you as a business owner the tools to check your own website and instruct your marketing team or web developer. You don’t need any technical expertise or web development skills.
We’ll give you a practical overview of:
- Core Web Vitals and the role they play in Google’s update
- The benchmarks you need to hit to keep your website competitive
- A free tool you can use to detect any problems on your website
- Practical tips to test your website for specific issues without needing any knowledge in web development
How does Page Experience Influence Google Search Results?
Google’s objective is to deliver the best possible results for any search term of its users. The content of your web page is the most important component: if the web page answers the question of the web user, then Google will show it in its search results pages.
However, with millions of web pages with relevant content on every conceivable topic, how does Google decide which page shows on the first position and which page is relegated to page 3 and onwards and never found?
The answer is in the page experience. If a web page delivers not only relevant content, but also a good user experience, then it will rank well in Google search results.
What are Core Web Vitals and how do they define Page Experience?
Core Web Vitals is a page experience metric that Google will use to determine the experience a web visitor will get when they land on a web page. The objective is to make that experience as pleasant as possible with a web page that loads quickly and focuses on elements of interactivity and visual stability.
Over the years Google has introduced a number of updates with that objective, such as mobile friendliness, security and page loading speed. The Core Web Vitals initiative adds new measurements to the mix and helps website owners to continue to focus on delivering a great customer experience.
Here is an overview of the metrics that Google considers important for user experience:
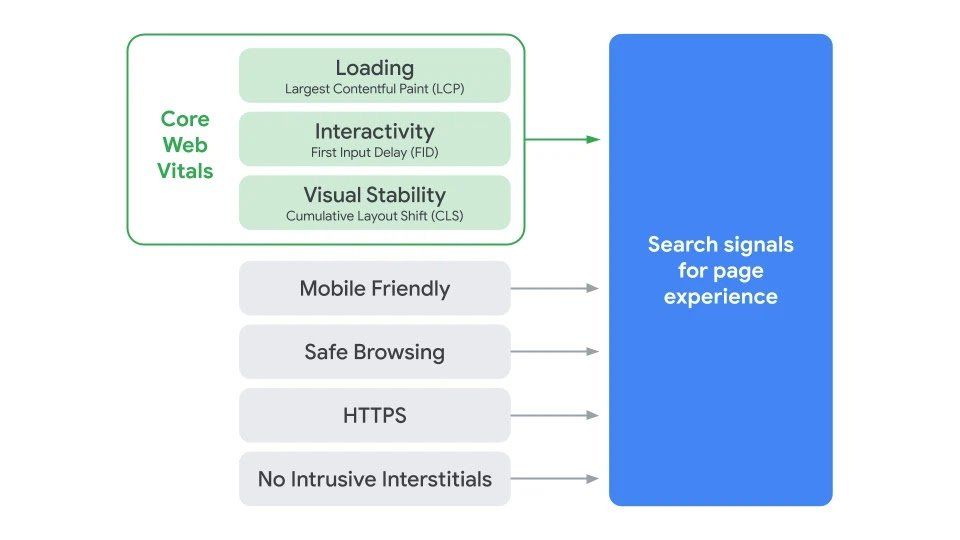
First a quick review of the existing metrics:
- Mobile-friendliness: does your website show well on a mobile phone? You can test this with Google’s mobile friendly test.
- Safe Browsing: this basically means that there is no malware on your website. You can test this with VirusTotal which uses over antivirus scanners and blacklisting services to see if your website has been flagged for malware.
- HTTPS: has an SSL certificate been implemented on your website? Here is a blog on everything you need to know about SSL certificates
- No intrusive interstitials: these are difficult to close popups that cover the content on your page and forces the users to close the pop-up just to continue reading.
Core Web Vitals will be added to the Page Experience signals. It refers to three different metrics on page speed and user experience:
- Largest Contentful Paint: how fast does the page load, how quickly do you see the content?
- Interaction to Next Paint (INP): how long does it take for the web page to become interactive and respond to user activity?
- Cumulative Layout Shift: how long does it take for the web page to be visually stable and for page elements to stop shifting around while the page loads?
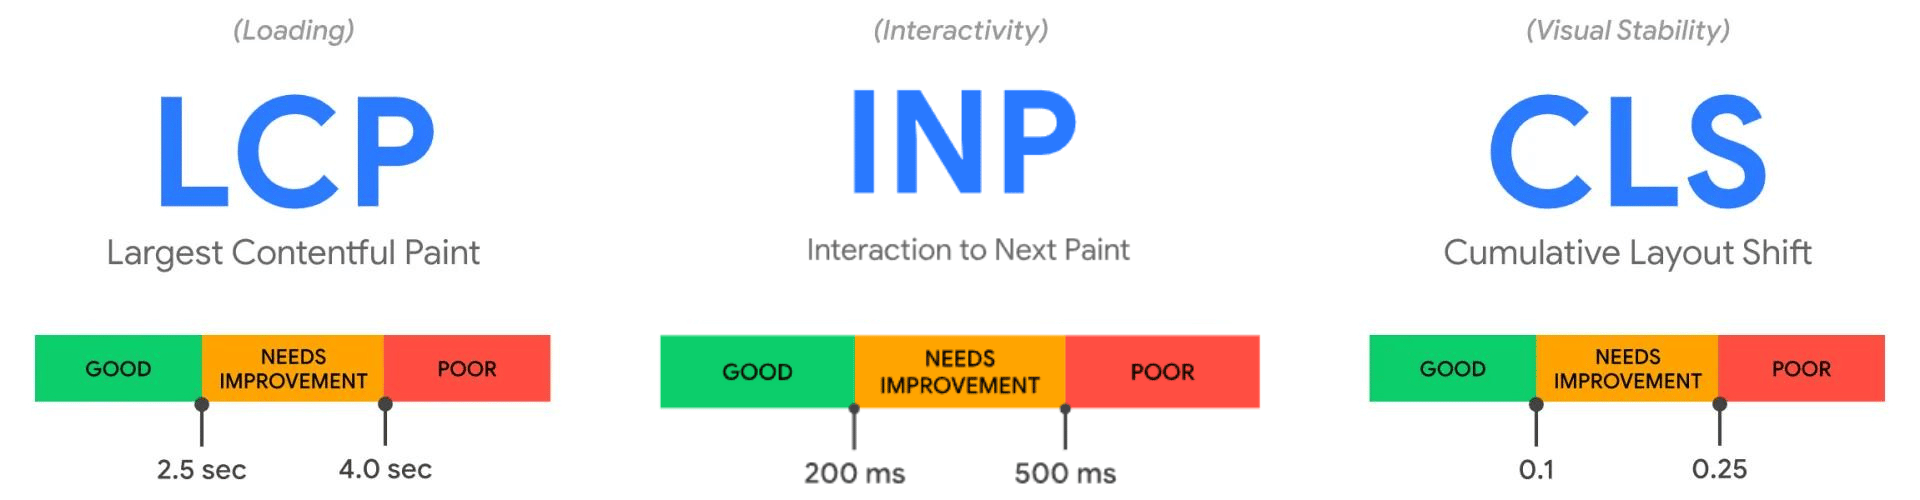
Largest Contentful Paint
The first metric is Largest Contentful Paint (LCP), and refers to the loading speed of the page. The page speed matters a lot because pages that load slowly provide a poor user experience, and results in people leaving your website without reading the content. The effects of a longer page load are quite immediate:
- If page load time increases from 1 second to 3 seconds, bounce rate increases 32%
- If page load time increases from 1 second to 6 seconds, bounce rate increases 106%
(Source: support.google.com)
LCP measures how long it takes for the largest bit of useful content to be displayed so you can start viewing it. It generally looks at the largest block of text on the page.
Benchmark:
- Good: below 2.5 seconds.
- Needs Improvement: 2.5 to 4 seconds
- Poor: more than 4 seconds
You can check your LCP score with Google PageSpeed Insights (and a bunch of other tools I am about to show you).
Interaction to Next Paint (INP) - (formerly First Input Delay)
If the content of a page is loaded, but the user can’t interact with it e.g. by scrolling the page, clicking a button or filling in a field, then it’s a frustrating experience. Interaction to Next Paint (INP) refers to interactivity on the web page and measures how long it takes before you can interact with it.
This metric really depends on when a user interacts with a page and how long it takes for that interaction to take effect.
Benchmark:
- Good: 200 ms or less
- Needs Improvement: 201-300 ms
- Poor: more than 500 milliseconds
Cumulative Layout Shift
While a page is loading, the elements on the page may shift around before the page becomes stable. This can lead to unexpected consequences, such as pressing a button just when a shift happens, and you end up tapping on a different button.
Layout shifts are normal to some extent, but the quicker the page stabilizes, the better. Cumulative Layout Shift (CLS) measures how many elements have shifted on the screen before the page becomes stable.
Benchmark:
- Good: 0.1 or less.
- Needs Improvement: 0.1 and 0.25
- Poor: more than 0.25
How to measure Core Web Vitals for a website
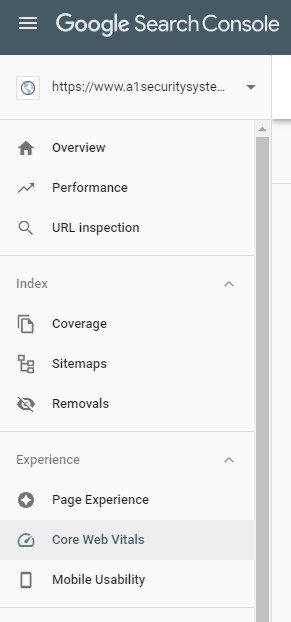
Google will measure Core Web Vitals on the basis of real anonymized user data from Chrome users. This information is available in Google Search Console, which is a free tool that we set up for each of our clients’ websites.
The problem is that this information builds up over time, so depending on the traffic to your website the Core Web Vitals information may not yet be available in their Google Search Console account.
Fortunately you can get a good approximation of Core Web Vitals with “lab-based” web performance tools such as www.GTmetrix.com. This free tool allows website owners to check the core web vital metrics.
GTmetrix does a great job at tracking Largest Contentful Paint and Cumulative Layout Shift, but it can’t replace the actual users to measure Interactive to Next Paint.
Instead, it approximates NIP with the metric Total Blocking Time (TBT), which tracks how much time is blocked by scripts during your page loading process.
So head over to GTmetrix and test your website!
How to Interpret the Core Web Vitals data from GTmetrix
Getting the Core Web Vitals for your website is as easy as heading over to www.gtmetrix.com and typing in your website address.
Note that the results are for an individual web page, and not for your entire website. You can use this test for a few different web pages on your website to get an idea on how well your website is doing.
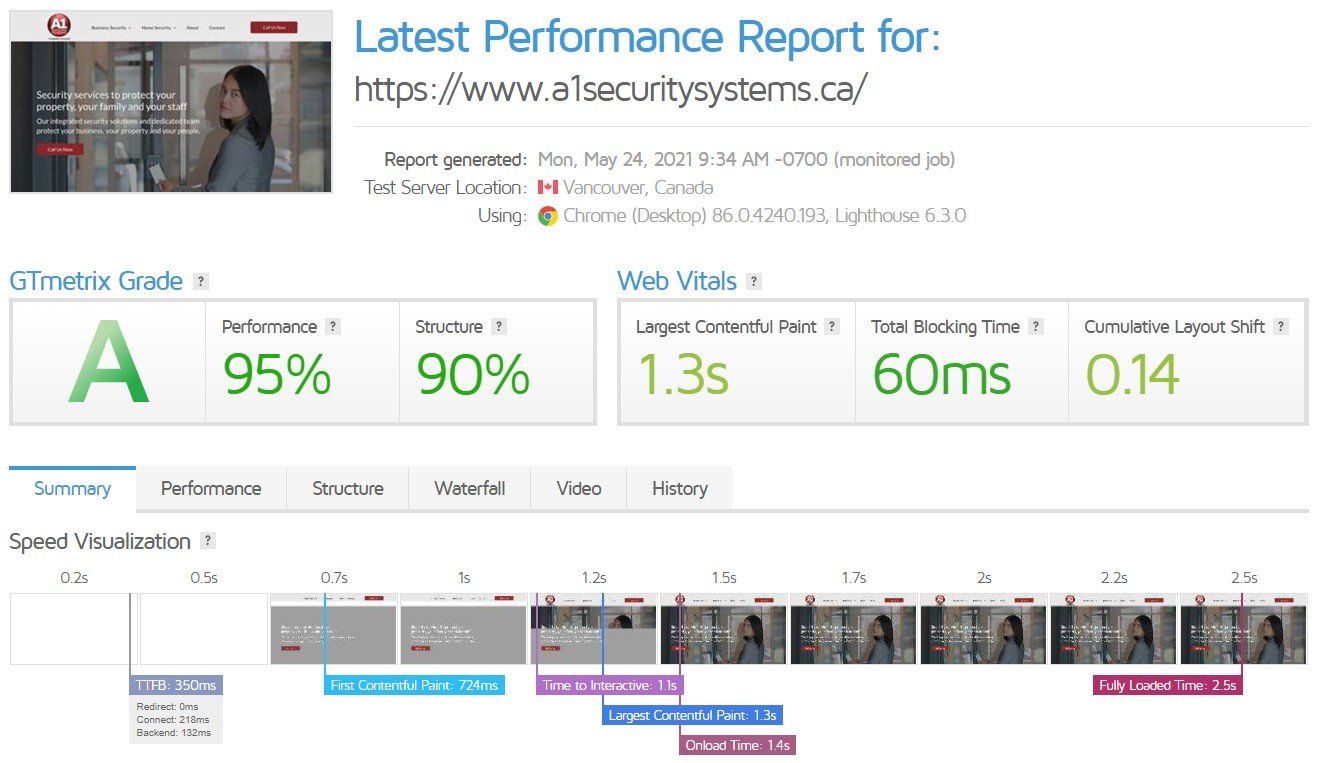
Below are the results for two pages on the website of our client A1 Security Systems in Oakville to illustrate the results:
And here are the results for the business security systems page:
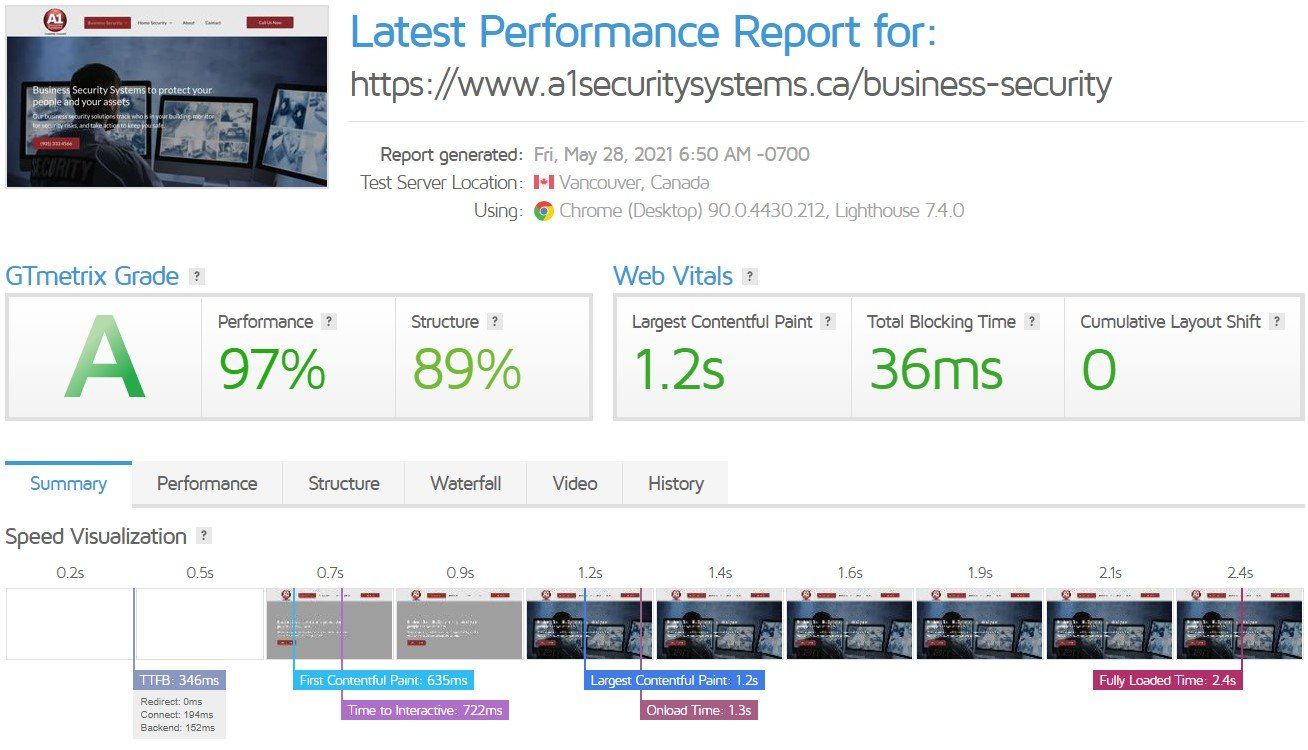
Here are the scores:
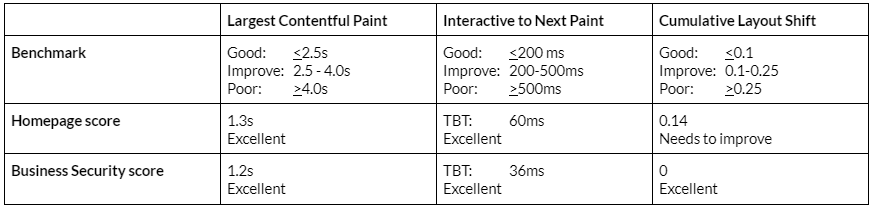
As you can see the results for this website are pretty good, with only the CLS score needing some improvement.
Tips on Improving Core Web Vitals on your website
If your website scores well on the three metrics, then you’ll probably see an improvement in your search engine ranking scores from June onwards!
Alternatively, if you are not scoring well on one or more of the metrics, then you’ll find some straightforward checks you can do below, and tips on how to get your team to improve the Page Experience of your visitors and raise your Core Web Vitals score.
Tip 1: Check your web pages for ‘heavy’ content
“Below the fold” refers to the time of newspapers on the stand, where editors would make sure that the most impactful content was placed on the top half of the front page. The “above the fold” content on a web page is the content that you see on your mobile or computer screen before you start scrolling.
How to do it
Right click on the image and select “Save image as..”:
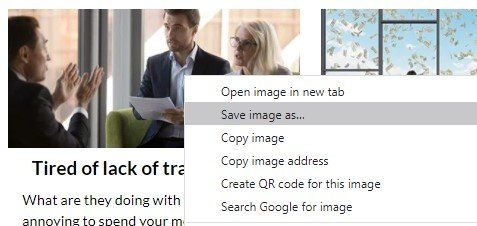
Then save it on your computer and check the file size by right-clicking it and selecting “Properties”. Large images may be up to a few hundred KB, while small images don’t need to be more than 40KB. If your images have a larger file size, then let your team optimize and compress the images.
We use tools like Photoshop and Irfanview to optimize the images for our clients’ websites. Irfanview is a free image editing software that is very powerful and relatively easy to use. Here is a link to our client user manual for image editing in Irfanview.
It will show you in simple steps how to improve a pretty poor image, crop and size it, and compress the file size:


If you’re looking for a quick solution without editing your images, then the websites tinyJPG and tinyPNG will do a great job at compressing images. Just drop your image on the site and download the compressed version!
Tip 3: Check Server Response Time
If your server is slow, then it takes longer for your web visitors to receive the content.
How to do it
Check the Time to First Byte (TTFB) score with GTmetrix. It identifies the time it takes for your visitors to receive the first information from your website. Google suggests having a server's response time lower than 600 milliseconds.
If your server is slow, then ask your team to do one or more of the following:
- Change your hosting provider
- Optimize your server
- Implement a content delivery network (CDN)
- Implement server caching
Tip 4: Check for unused code on your website
Your web page is generated by computer code like JavaScript. Your web page may contain code that is not used, which can delay the loading of the web page. It’s very easy to check, just follow these steps:
How to do it
- Right-click and choose 'Inspect'. A new window will appear.
- Select the 3 dots at the bottom of the screen and choose “Coverage”
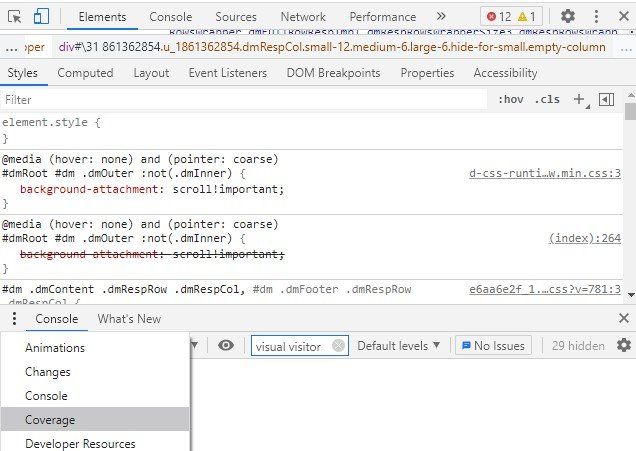
- Then click the “reload” button. The web page will reload and show you how much code is unused:
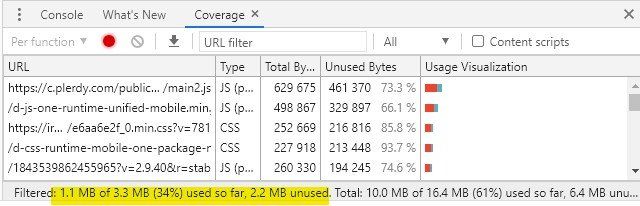
In this example two-thirds of the code is unused, and the download speed of the website can be improved by your web developer.
Tip 5: Check if your web page specifies the height and width of images
When a web page is being built up, then the web browser can reserve space for any image even before it has loaded, as long as the height and width of the image are identified. If the image size is not specified, then a “layout shift” will likely occur once the page is fully loaded.
How to do it
Right-click an image on your website and click “Inspect”. A new window will open which shows you the code of your web page, with the code for the image highlighted. Check if the code shows the height and width of the image:
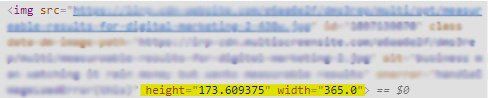
If it doesn’t show the height and width, then that may cause a “layout shift” when the page is loading. Your web developer will be able to make that improvement.
Do you have any questions on the above, or would you like to share your experience? Just email ideas@mawazo.ca or call +1 (833) 503-0807.
At Mawazo Marketing we work with owners of B2B companies who want to accelerate their business. We help them with a concrete digital growth plan, a website that saves operational cost, and a digital marketing system that generates leads. For qualifying clients we offer a 5x ROI guarantee: if we don't reach the objective, then we pay back the difference. Book a Free Strategy Session to find out more.