
You want to see a clear return on your marketing investment
Our analytics give you transparent, real-time visibility into what we do and the value it creates for your business.
As a business leader, you need clear, actionable information—not endless spreadsheets. We deliver real-time dashboards and monthly reports on your complete web presence that are easy to understand and focused on what truly matters: profit, pipeline, and performance.
We Report on What We Do—and What It Delivers
Our reporting gives you visibility into two critical dimensions of your marketing:
Lead Indicators (Activity):
What we're doing for you right now, such as content creation and publishing, search engine optimization, advertising campaigns, outreach activities, and technical improvements. You see work in progress by category and always know exactly what's happening in your account.
Lag Indicators (Results): What those activities produce over time: phone calls, form submissions, qualified leads, search engine rankings, website traffic and conversions, social media engagement, email newsletter performance, digital advertising results, etc.
This dual view means you're never left wondering, "What are they actually doing?"—and you can clearly see the business results of each initiative.
This dual view means you're never left wondering, "What are they actually doing?"—and you can clearly see the business results of each initiative.
Real-Time Dashboards
You'll have access to live dashboards that show both activity and outcomes across your entire digital marketing system.
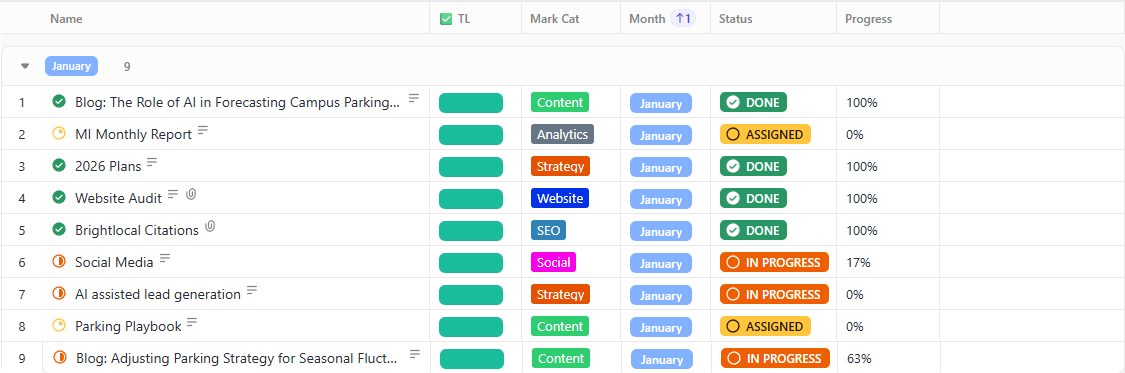
Activity Dashboard
See every major marketing task we're working on, organized by category—SEO, content, advertising, outreach, and more. Track progress in real time and know what's happening without chasing status updates.
Results Dashboard
Monitor the metrics that matter most: Google rankings for agreed keyword sets, website traffic and conversions, social media engagement trends, advertising performance by channel, and most importantly—the number of leads generated and their estimated value to your business.
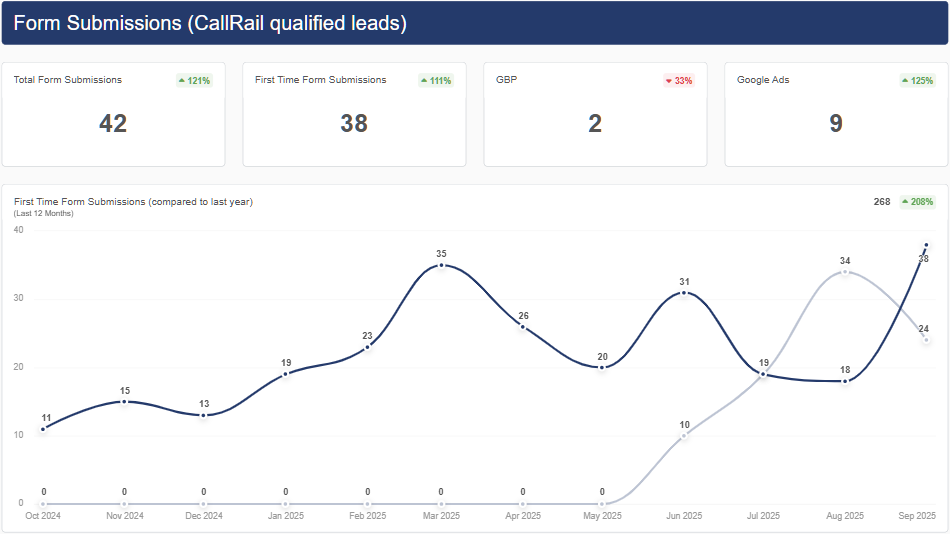
Lead Tracking That Connects to Revenue
Defining Lead Value: Together, we define a Lead Value model based on your average deal size, your gross margin, and your typical conversion rate from lead to customer.
What We Track: We then track every lead we generate for you online and calculate the individual value of each phone call, each request for service, each quote request or RFQ, and each email subscription or gated content download.
Our system tracks and records inbound calls for quality assurance and training, identifies visiting companies where possible and alerts your team to high-intent prospects, and attributes leads to the correct source so you see which activities are creating the most value.
The Result:
you can see exactly how your marketing system contributes to revenue, not just clicks.
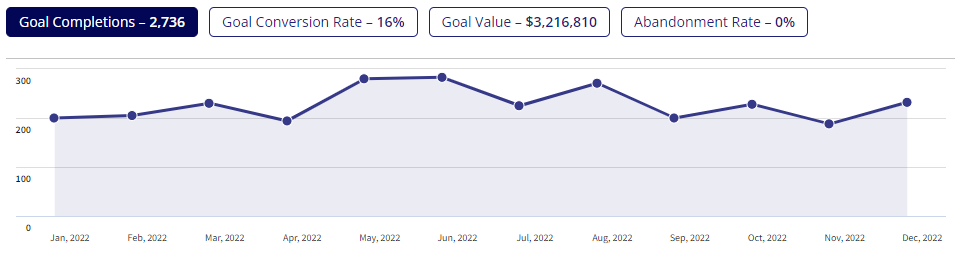
Delivering Real Results
We report on all standard measures of digital marketing, but we go further by reporting on the value we create for your business. For example, the digital marketing system we implemented for Horton Automatics of Ontario delivered $3.2M in lead value in 2022—a 68% increase from the prior year.
Monthly Insights and Strategy Reviews
Dashboards show you what's happening. Our regular reviews help you decide what to do next.
Monthly: You receive a concise summary of results with clear insights and recommendations for the coming month.
Quarterly: We step back and review strategy, budget, channel performance, and opportunities to improve efficiency, lead quality, and ROI.
You get a partner who doesn't just track the numbers—we help you interpret them and turn them into practical next steps for your team.
Frequently Asked Questions
Would you like to know more?
Analytics Reporting - Contact Us
Analytics insights from our blog